To add a widget to the dashboard,
1. Click ![]() . The Add New Widget pop-up window displays.
. The Add New Widget pop-up window displays.
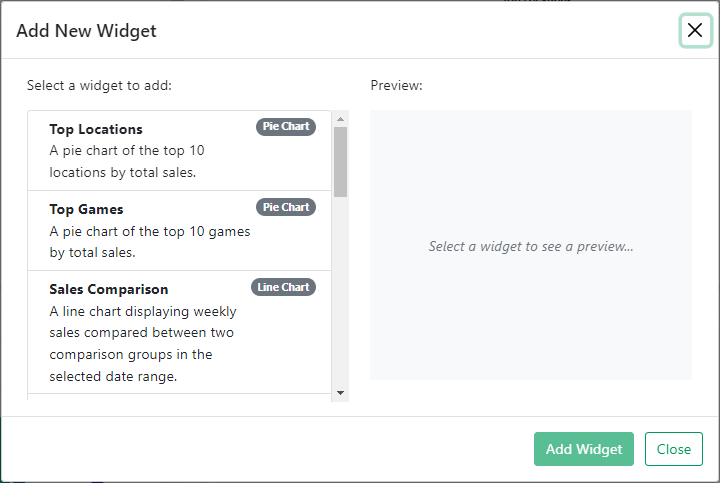
2. Select the widget you would like to add and click ![]() .
.
Widgets display data in either a graphical or a tabular format, depending on the type of widget.
List of widgets:
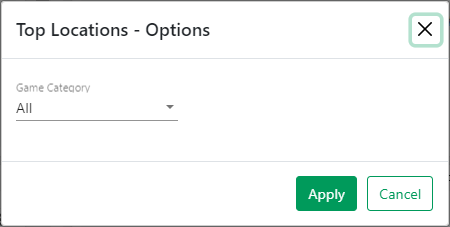
Top Locations - A pie chart displaying the top 10 locations based on total sales in the selected date range. The user can filter by game category. This widget is available to lottery users and corporate account administrators.
Top Games - A pie chart displaying the top 10 games based on total sales in the selected date range. Game categories (Scratch-Offs and Draw) will be added showing top 5 for each
Sales Comparison - A line chart displaying weekly sales compared between two comparison groups in the selected date range. The user can filter by game category. The available comparison types, depending on the user’s access, can be any of the following:
All Corporate Accounts
All Locations
Corporate Account
Location
State Average
City Average
Area
District
Business Type
Top 10 (locations or corporate accounts)
Top 30 (locations or corporate accounts)
Sales by Game Category - A pie chart displaying total sales by game category in the selected date range.
Scratch-Off Games - A table that displays the latest or top selling scratch-off games. This widget has filter options to select between the latest release/ship date or top selling instant games. When latest is selected, the game’s release/ship date will be shown. When top selling is selected, the game’s total sales will be shown.
Jackpots - A table that displays the latest jackpots for draw games.
Latest Scheduled Reports - A table that displays the latest reports that have been scheduled to run with their run details. Delivery method (SFTP or email) will also be noted.
Scratch-Offs Sales by Price Point - A bar chart displaying total Scratch-Offs sales by price point in the selected date range.
Game Category by Year -- A column chart displaying the last three years of sales or commissions by game category. The current year is extrapolated to show actual and projected sales/commissions. This widget includes filter options to select between sales and commissions.
Commissions - A column chart displaying commissions for the current week, month, and calendar year to date. Earnings data will be based on the current user’s access.
Big Winners - A column chart displaying totals of winners sold and paid for the current week, month, and calendar year to date. Winner data will be based on the current user’s access. This widget has filter options to select the min. prize amount.