Game Sales
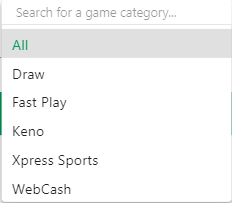
The Game Sales page displays a combination of graphical and tabular data. The screen includes two graphs at the top of the screen above the table – Sales by Game Category and Game Category Sales History. In addition to the global filters, this screen includes a Game Category filter to view sales for a specific game category.
-
The Sales by Game Category graph is a pie chart showing the percentage of total sales for each non-Scratch-Off game category within the specified filter criteria. Moving your mouse pointer over a game category will display the total sales amount. When filtering on a specific game category, this graph will show total sales by game under the specified category.
-
The Game Category Sales History graph is a line chart showing net sales as the Y-axis value and the week end date as the X-axis value. The graph includes a line for each non-Scratch-Off game category. The data displayed will be filtered by the provided filter criteria. Moving your mouse pointer over a point on the graph will display the sales amount for that week and category. When filtering on a specific game category, this graph will show weekly sales by game under the specified category.
Each row displays the following information:
-
Game Name
-
Game Category
-
Payouts
-
Net Sales
What You Can Do
Display game sales by retailer location
Display corporate game sales
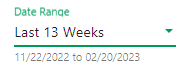
Display data for a different time period
Filter data displayed on screen
View the graphical data in "Full Screen View"
Sort data by a specific column
Print the data displayed on the screen
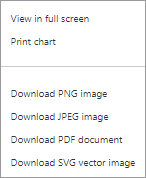
Download the data displayed on the screen as an image
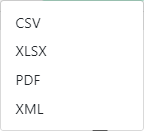
Export the data displayed on the screen
Zoom in on a timeframe
 . The following pop-up window displays: