Sales Map
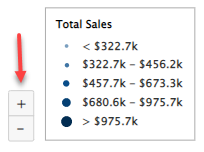
The Sales Map page displays an interactive bubble map for the currently selected corporate account and/or retailer location. The map shows a data point for each retailer under the selected corporate account. The size of each plotted point will be reflective of the retailer’s total sales in the selected date range – the larger the point on the map, the higher the sales for that retailer. Hovering over a data point will show the total sales amount for that retailer.
NOTE: This page will only be available to users with corporate level access and higher.
What You Can Do
Display sales map by retailer location
Display corporate sales map
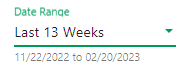
Display data for a different time period
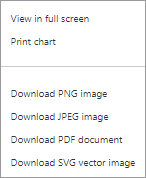
View the map in "Full Screen View"
Print the data displayed on the screen
Download the data displayed on the screen as an image
Zoom in on an area of the map
 . The following pop-up window displays: