Sales by Location
The Sales by Location screen displays a table containing sales data for each location. The data may be filtered by date range, corporate account, a specific location, or search keyword by retailer.
Each row displays the following information
Next to each location name there will be a magnifying glass icon which when clicked will present a pop-up with weekly sales in graphical format, available in line chart or pie chart.
What You Can Do
Display sales by retailer location
Display corporate sales by location
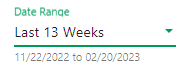
Display data for a different time period
Display weekly sales in graphical format
Sort data by a specific column
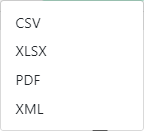
Export the data displayed on the screen